Once the journal title is selected under A on the home page, the bibliometric portrait of the selected journal is displayed.
In the Info section, bibliographic information about the journal and the publisher is provided. These pieces of information are taken from the SCIndeks Editor Service, where the journal information is updated by the publishers. Changes are updated daily.
For the journals that are not indexed in SCIndeks but are subject to evaluation in the JBR, this information is entered by the publisher of the JBR on the basis of publicly available ISSN catalogues and other reliable online sources. Changes are updated annually.

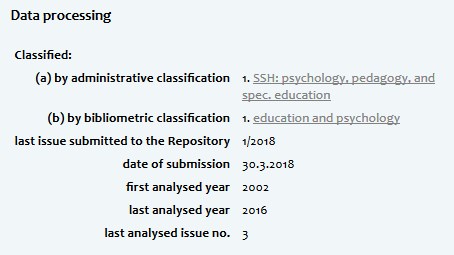
The Data processing section provides the basic information on the classification, the journal's record in the SCIndeks Repository and data processing. This information is updated automatically based on the SCIndeks Repository. For the journals that are not indexed there, the information is updated annually, based on publicly available sources.
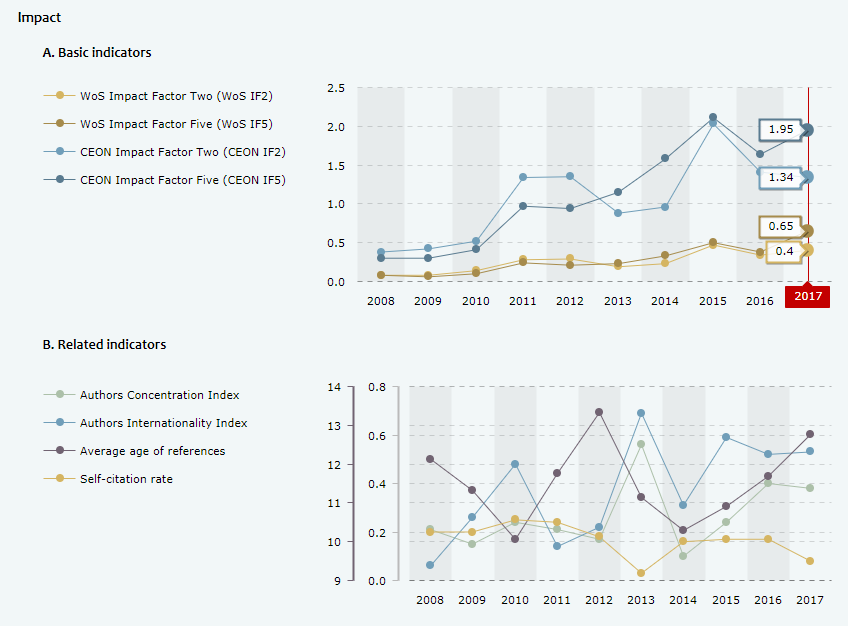
In the Impact section, the journal's impact, expressed by four types of impact factors, is graphically represented (line chart). Each profile can be removed by clicking on its description, to enable a clearer insight into the scores. By hovering the mouse over the chart, figures accurate to two decimal places are provided. The overview includes the scores achieved over the last ten years during which the journal was monitored.
Another line chart shows the four bibliometric indicators relevant for the estimation of the journal's impact and it should be consulted when interpreting the results provided in the previous chart. This line chart behaves the same as the previous one.
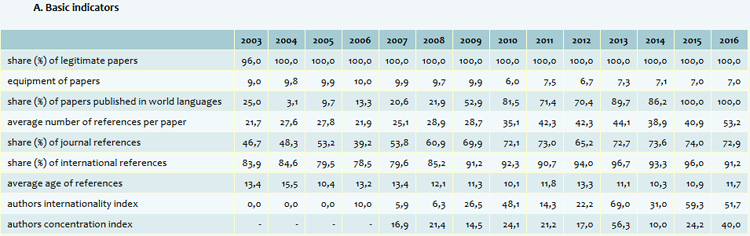
The Bibliometric quality section shows a tabular and a graphical representation of the bibliometric quality indicators for a journal for the entire period covered by the JBR.
Under A, the Basic indicators are displayed. The scores are comparable over the years, except for the indicator equipment of papers, which has changed over the years, being adjusted to the changing standards in scholarly publishing.
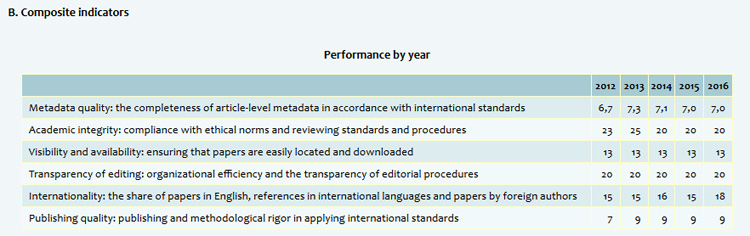
Under B, the composite bibliometric quality indicators are shown. The scores achieved by the journal are given in a table for each year, starting with 2012, when the composite indicators were introduced.
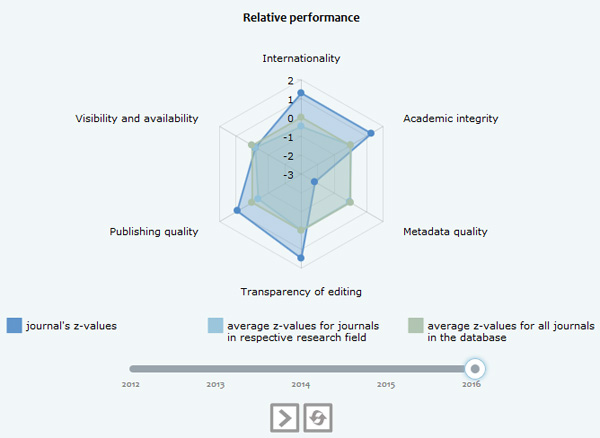
A radar (spider) chart showing the relative performance of the journal according to the same, composite indicators is also provided. The scores are expressed as z-values, to make it possible to:
- compare the journal with the average scores for all analyzed journals (z = 0, green), as well as with the journals from the same group (blue) and at the same time,
- compare the journal's scores for individual indicators.
The greater the distance between the intersection of the chart's axes and the points describing its profile, the better the score.